-------------------------------------------------------------------------------------------------------------------------

ISB Experience Tailored to you
Help us tailor the website experience to your taste. Make some selections to let the website work better for you.
I am Interested in
Suggestions for You
-------------------------------------------------------------------------------------------------------------------------
What We Do?
Every Thursday, at IndiaPulse@ISB, we release new insights based on high-frequency data curated from reliable and recognized sources.
Our insights shed light on economic activity, jobs, health, and skills. We work with high-frequency indicators and show activities at the spatial granularity of the states and in some cases, intra-state.
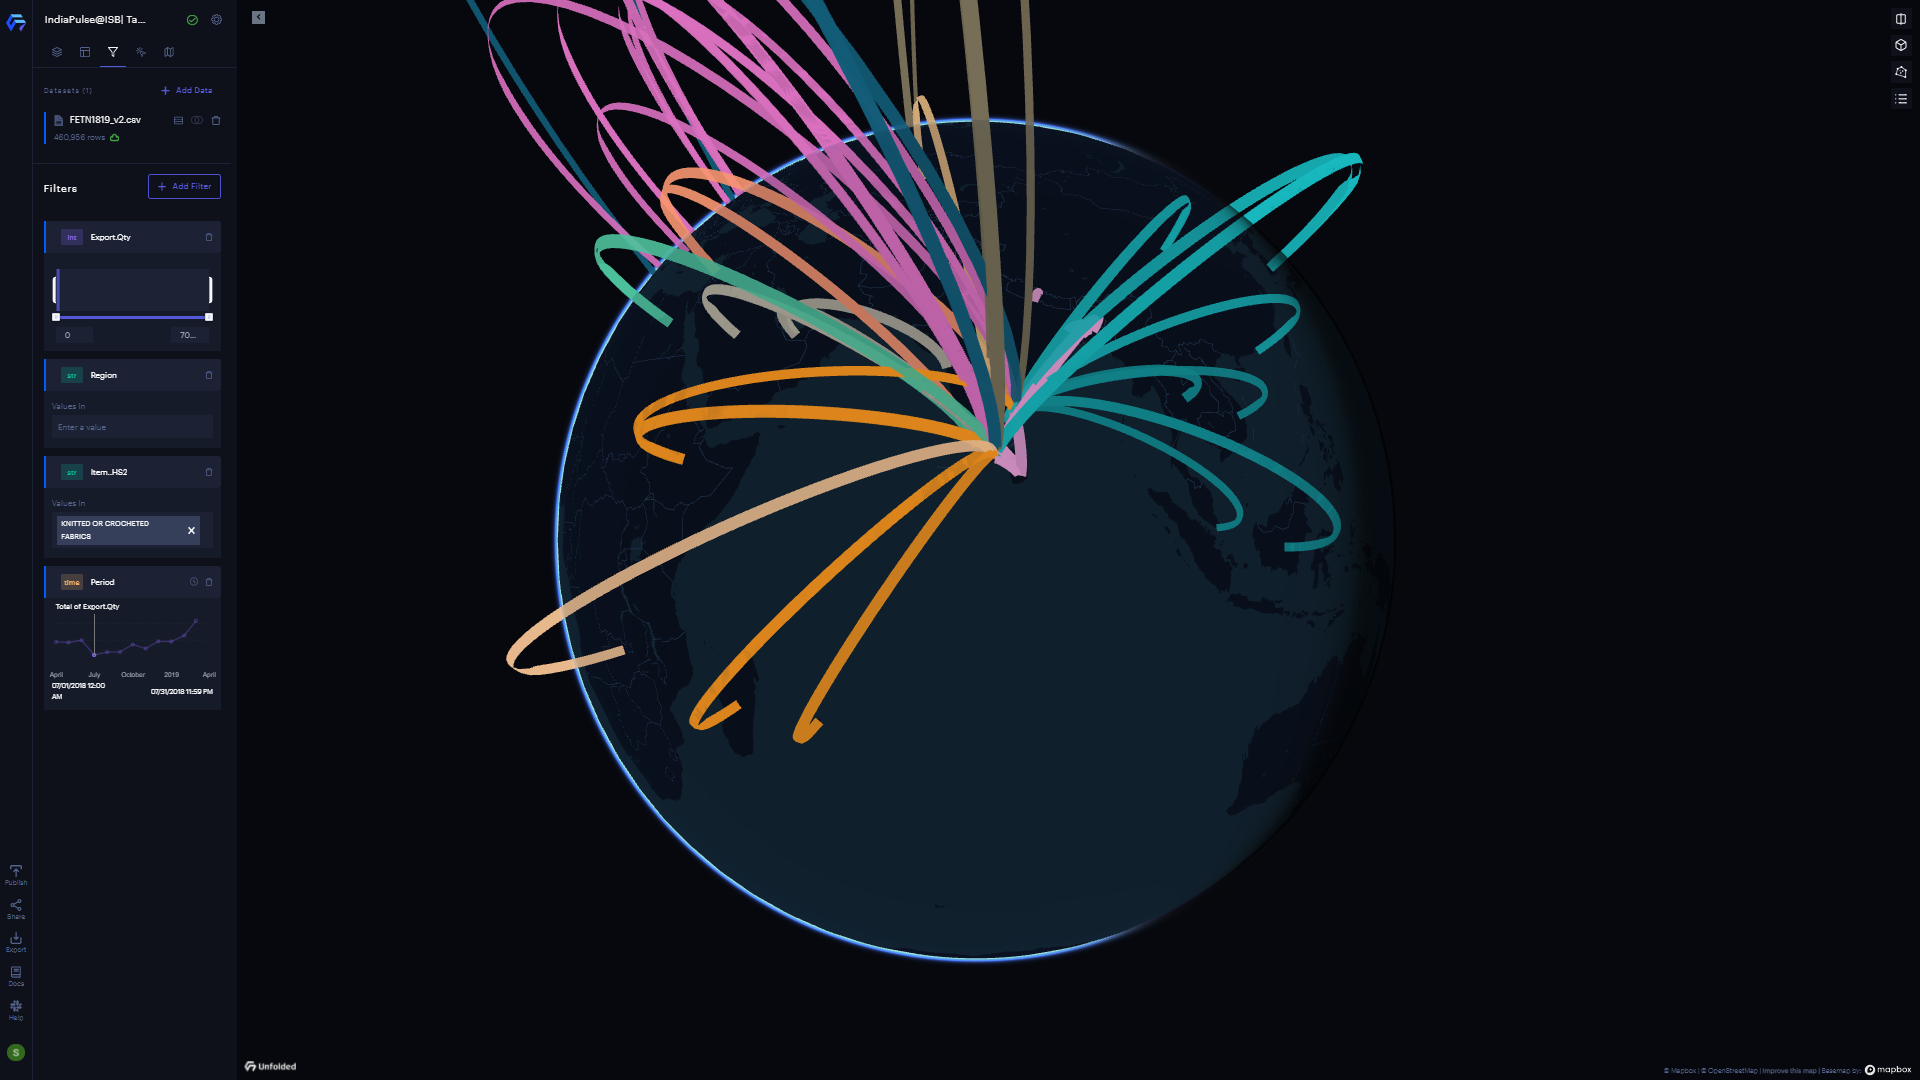
Pulse on Tamil Nadu's Global Exports
This week IndiaPulse@ISB offers high-resolution insights the extent, scale, and trends of Global Exports from Tamil Nadu. By using a flow-based visualization tool, we show the extent of commodity-wise exports from Tamil Nadu to domestic as well as international ports. The sheer scale of Tamil Nadu's export network is visualized in a manner that allows users to visualize and study the export trends from the state of Tamil Nadu for 2018-2019. By using classified data on commodity-wise monthly exports based on the US Harmonized Codes system, the user can see the coverage, region, and extent of the export over a period of time. The visualization helps in exploring the global export trends as well as understand domestic and international networks of trade for the state of Tamil Nadu.
We observe that the top 5 industries of export for Tamil Nadu (based on HS codes) are:
1. Road Vehicles and Parts
2. Articles of Apparel and Clothing Accessories
3. Machinery and Mechanical Equipment for Nuclear Reactor Equipment and Boilers
4. Electrical Equipment such as TV, Recorders etc.
5. Footwear and Gaiters
We observe that in terms of trade destinations by value, the top 5 are: USA, Germany, UK, China, UAE
We pose some interesting questions:
- Can you find some interesting export trends between emerging markets across the world and their linkages to Tamil Nadu?
- How are region-wise differences apparent in terms of Export Quantity and Value?
- Within Tamil Nadu, which ports export the most and least amount of goods? Is there a structural reason for this difference?
22 Apr
2021
2021
Diri
Video:
- We use data published from various public sources and national-level reports.
- The data is broken down by Export region, quantity, value in Indian Rupees, Port of Exit, and Entry.
22 Apr
2021
2021
Diri
Dashboard
Explore the dashboard for interesting trends of domestic and international exports from Tamil Nadu to the rest of the world.
Pulse on What Matters? #IndiaPulse@ISB #Hackathon
This week IndiaPulse@ISB offers high-resolution insights into What Matters? We look at spatially explicit metrics of various infrastructure facilities at the District level for the state of Tamil Nadu. We explore the second module of the dashboard made for TN Guidance, where we look at the 4 domains of infrastructure that potential investors look at for locating industries: Accessibility, Electricity and Data Networks, Natural Resources, and Financial Infrastructure.
By combining data from various public sources, we develop an exploratory tool that captures the state of infrastructure at the district level, we provide comparative outcomes on district-wise performance in Tamil Nadu. We discuss the myth of Southern Tamil Nadu being historically underdeveloped and explore the outcomes for these districts in a comparative manner.
We observe that though some infrastructure metrics are lower for Southern Tamil Nadu, it is difficult to assert that the districts are underdeveloped.
We pose some interesting questions:
- Can this analysis be further refined using metrics such as Network Density and temporal variations?
- Is there a method to detect an error in the dataset, given some observations are lower than expected for districts?

15 Apr
2021
2021
Diri
Video:
-We use data published from various public sources and national-level reports.
-The data is broken down districts, allowing the user to filter and dynamically update metrics for the selected district
15 Apr
2021
2021
Diri
Dashboard
Explore the dashboard for the following insights
- What metrics are the most critical indicators of district development?
- What other indicators can be added to the current stack to improve our understanding of the socio-economic performance of Tamil Nadu?
- Visual elements that may be used by participants in the upcoming dashboard
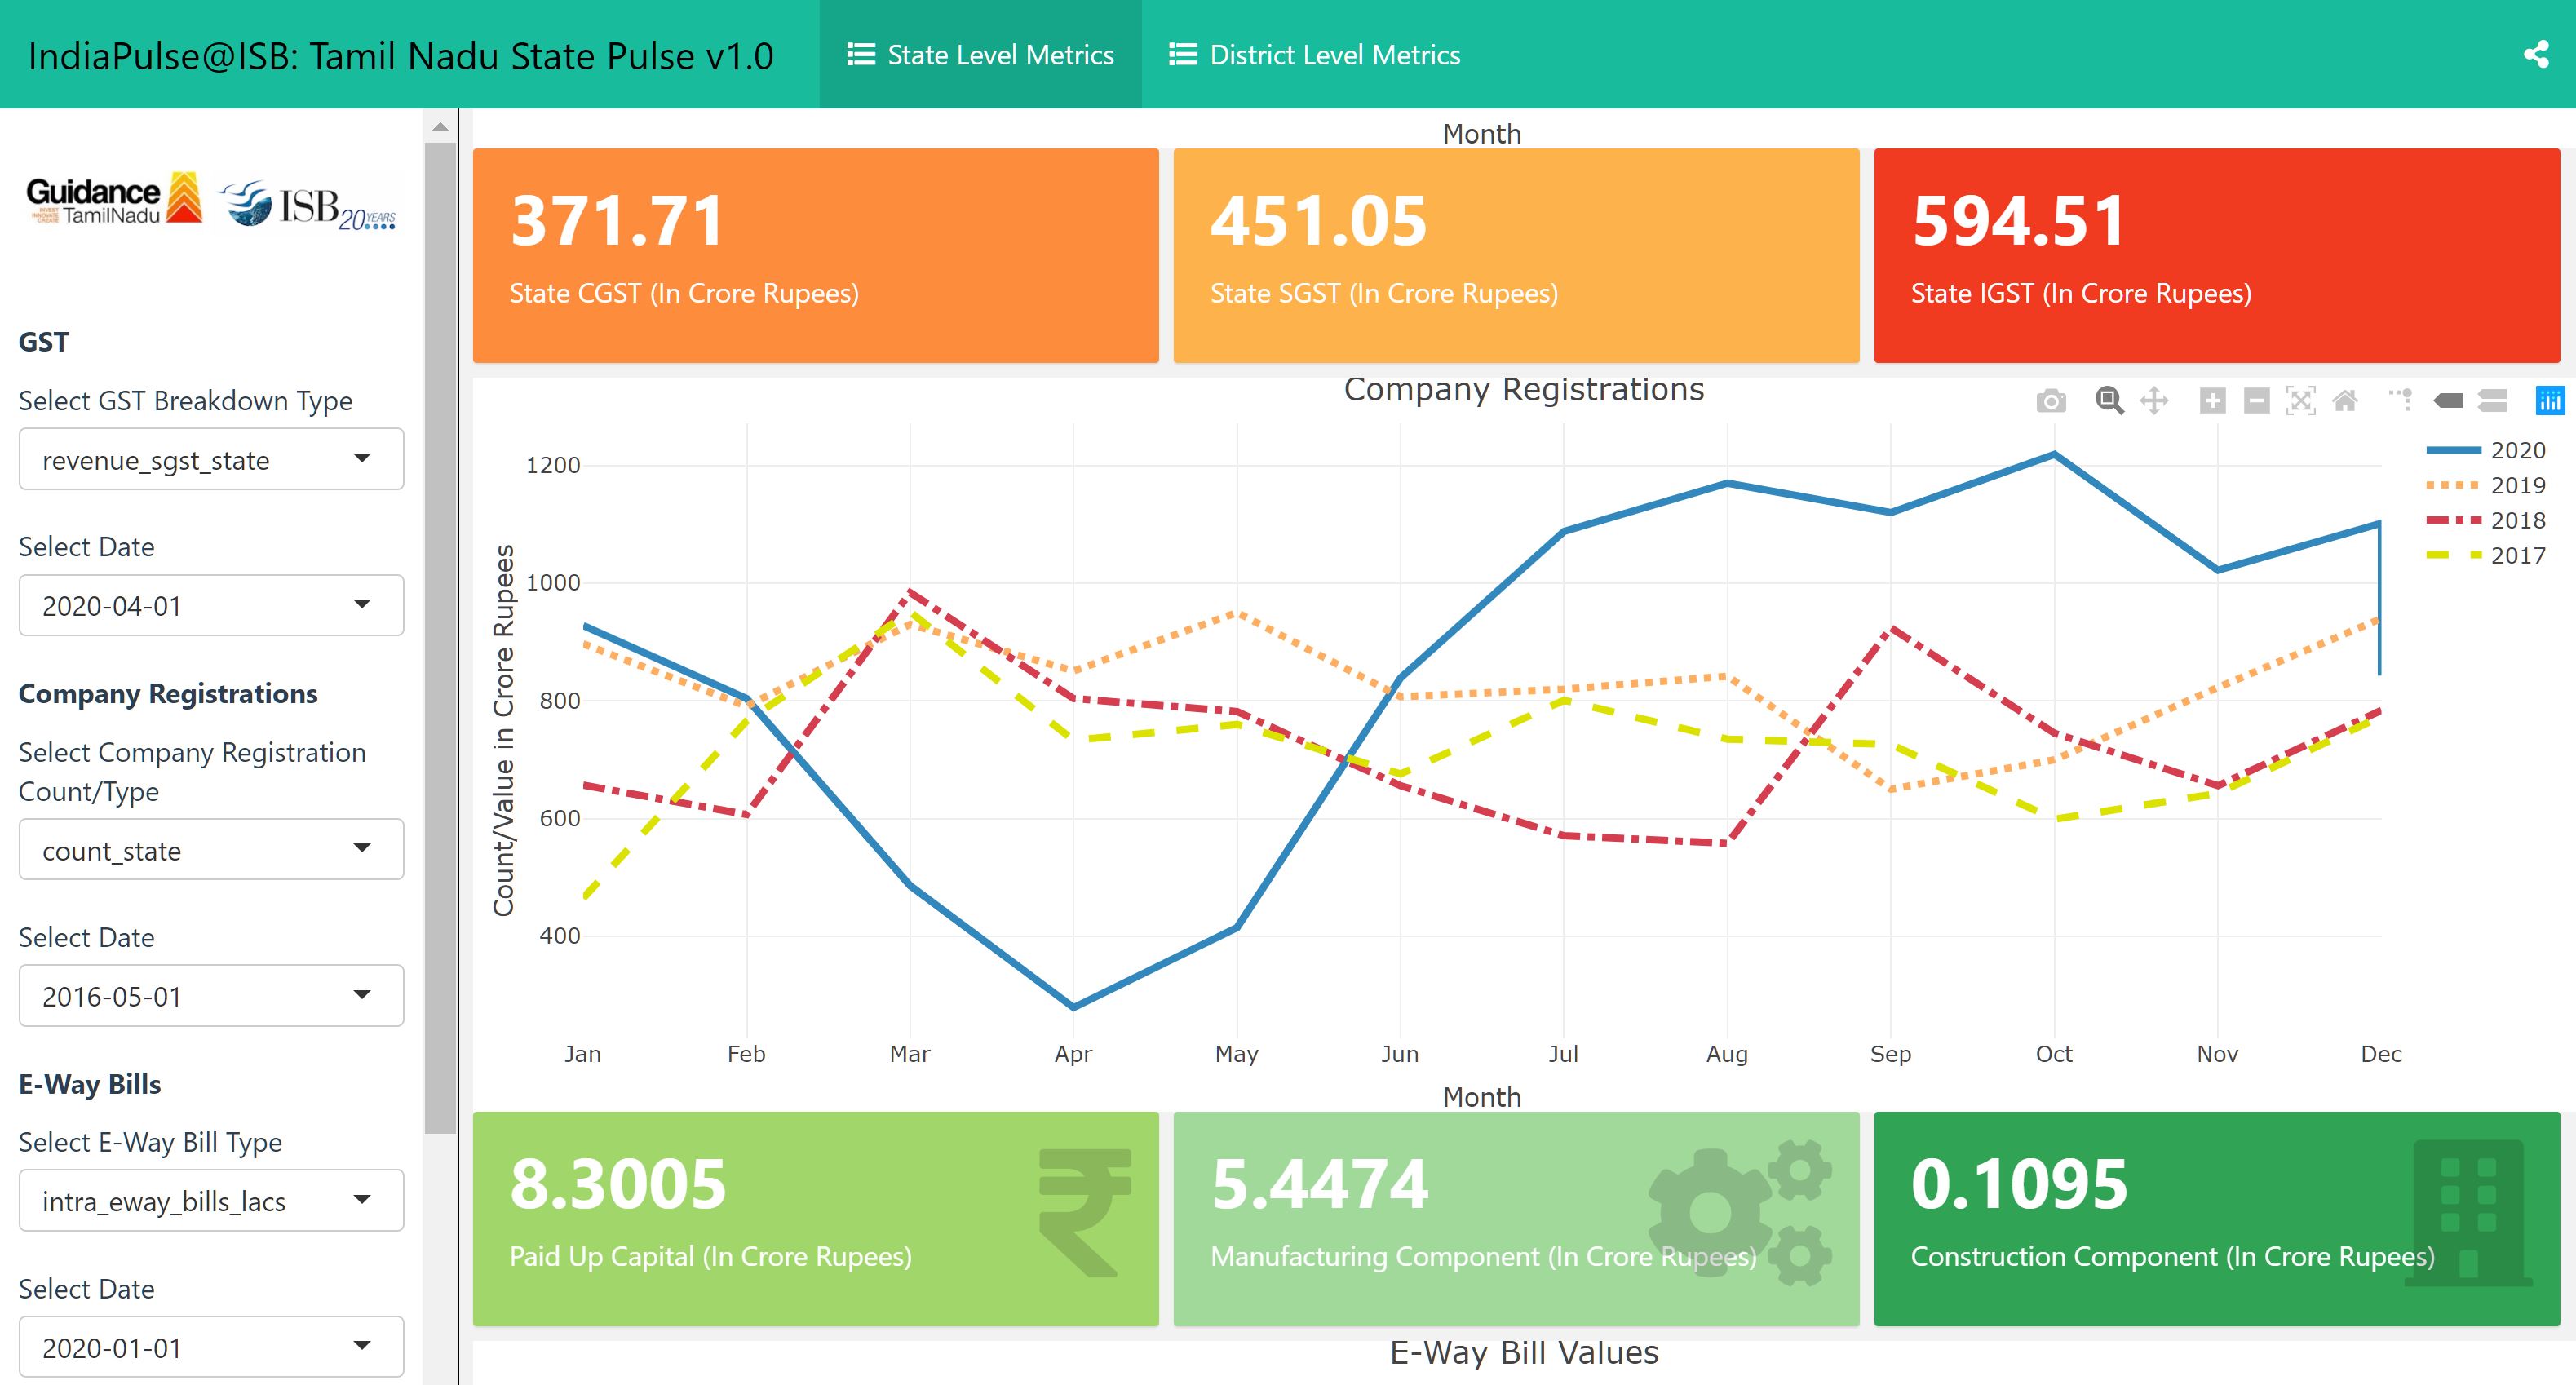
Pulse on Economic Activity Indicators in Tamil Nadu
This week IndiaPulse@ISB offers high-resolution insights into the economic activity in the state of Tamil Nadu. We present the first of two modules developed as part of ISB's collaboration with TN Guidance for the TNPulse application, focusing on macroeconomic indicators such as GST components (IGST and SGST), Company Registrations, Eway Bills, Electricity consumption, and Aggregate Agricultural Market Value.
By combining data from various public sources, we develop an exploratory tool that captures year-wise indicators of economic activity at various resolutions. The dashboard allows the addition of new indicators at different spatial and temporal resolutions and key metrics from the indicators.
We infer the economic recovery patterns from various indicators, showing leading and lagging characteristics. We observe that GST Components, Company Registrations, and Eway Bills provide a coincident indicator of the state of the economy, showing us the V-shaped recovery of the economy.
On the other hand, Agricultural Market Value is a leading indicator of economic activity, and Electricity Consumption is a lagging indicator of economic activity.
- We observe that the period of recovery ranges from July to September across each indicator
- We see that economic indicators have consistently risen beyond their average trends from previous years after the period of economic recovery.
- We pose some interesting questions:
- Does the unique shape of the recovery across each indicator help us in understand the correlation of each indicator with on-ground economic activity?
- Can these indicator trends be used to predict the economic impact of a potential second wave of COVID-19 in the state?
08 Apr
2021
2021
Diri
Video:
- We use data published from various public sources and national-level reports
- The data is broken down for year-wise analysis and provides an overview of the state economy.
08 Apr
2021
2021
Diri
Dashboard
Explore the dashboard for the following insights
- What indicators correlate with each other to indicate economic recovery within the state of Tamil Nadu?
- Is there likely to be a drop in critical indicator values in the state if another wave of cases develops?
- What other indicators can be added to the current stack to improve our understanding of the socio-economic performance of Tamil Nadu?
Pulse on Water Availability and Scarcity in India
How does India use its groundwater? Where is groundwater being used intensively? How does exploitation of groundwater relate to the availability of surface water and the potential for industrial development?
This week IndiaPulse@ISB offers high-resolution insights into the availability of ground and surface water across the country. We explore the changing landscape of water use in India and identify spatial units where groundwater availability is critically low.
By using the groundwater assessment criteria of the Central Groundwater Board from 2011 to 2017, we create a continuous spatial index of groundwater scarcity across India and compare it to the availability of surface water through rivers, dams and their command areas.
We observe an increase in both the coverage and intensity of groundwater scarcity from 2011 to 2017. When compared with the distribution of surface water, we observe that areas that are, and will likely face water scarcity in the future have limited access to surface water as well as a scarcity of groundwater resulting from overexploitation.
- We observe that beyond desert areas such as Rajasthan, there has been a growth of water-scarce regions in Maharashtra, Andhra Pradesh, Tamil Nadu and Uttar Pradesh.
- We also observe that most water-scarce regions overlap with monsoon dependent regions of the country.
- We pose some interesting questions:
- Is scarcity of groundwater higher in upstream states or downstream states?
- How will the scarcity of groundwater and the lack of access to surface water affect patterns of industrialization and urbanization in the future?

01 Apr
2021
2021
Diri
Video:
- We use the data published by Central Groundwater Board on Groundwater Assessments from 2011 to 2017
- By normalizing the assessments over a spatial grid of 50km x 50km resolution, we create a index of groundwater scarcity, with 1 being least scarce (green) and 5 being most scarce (red).
- We overlay major rivers of India, dams and their command areas to assess the comparative access to ground and surface water.
01 Apr
2021
2021
Diri
Dashboard
Explore the dashboard for the following insights
- What are the hotspots of water scarcity in the country?
- Given that water is an essential resource for industrial development, where will it be more difficult for states to promote industrial areas given the state of access to surface water and groundwater?
- Which districts are most likely to face a shortage of water in the upcoming years given the lack of access to surface water and scarce groundwater.
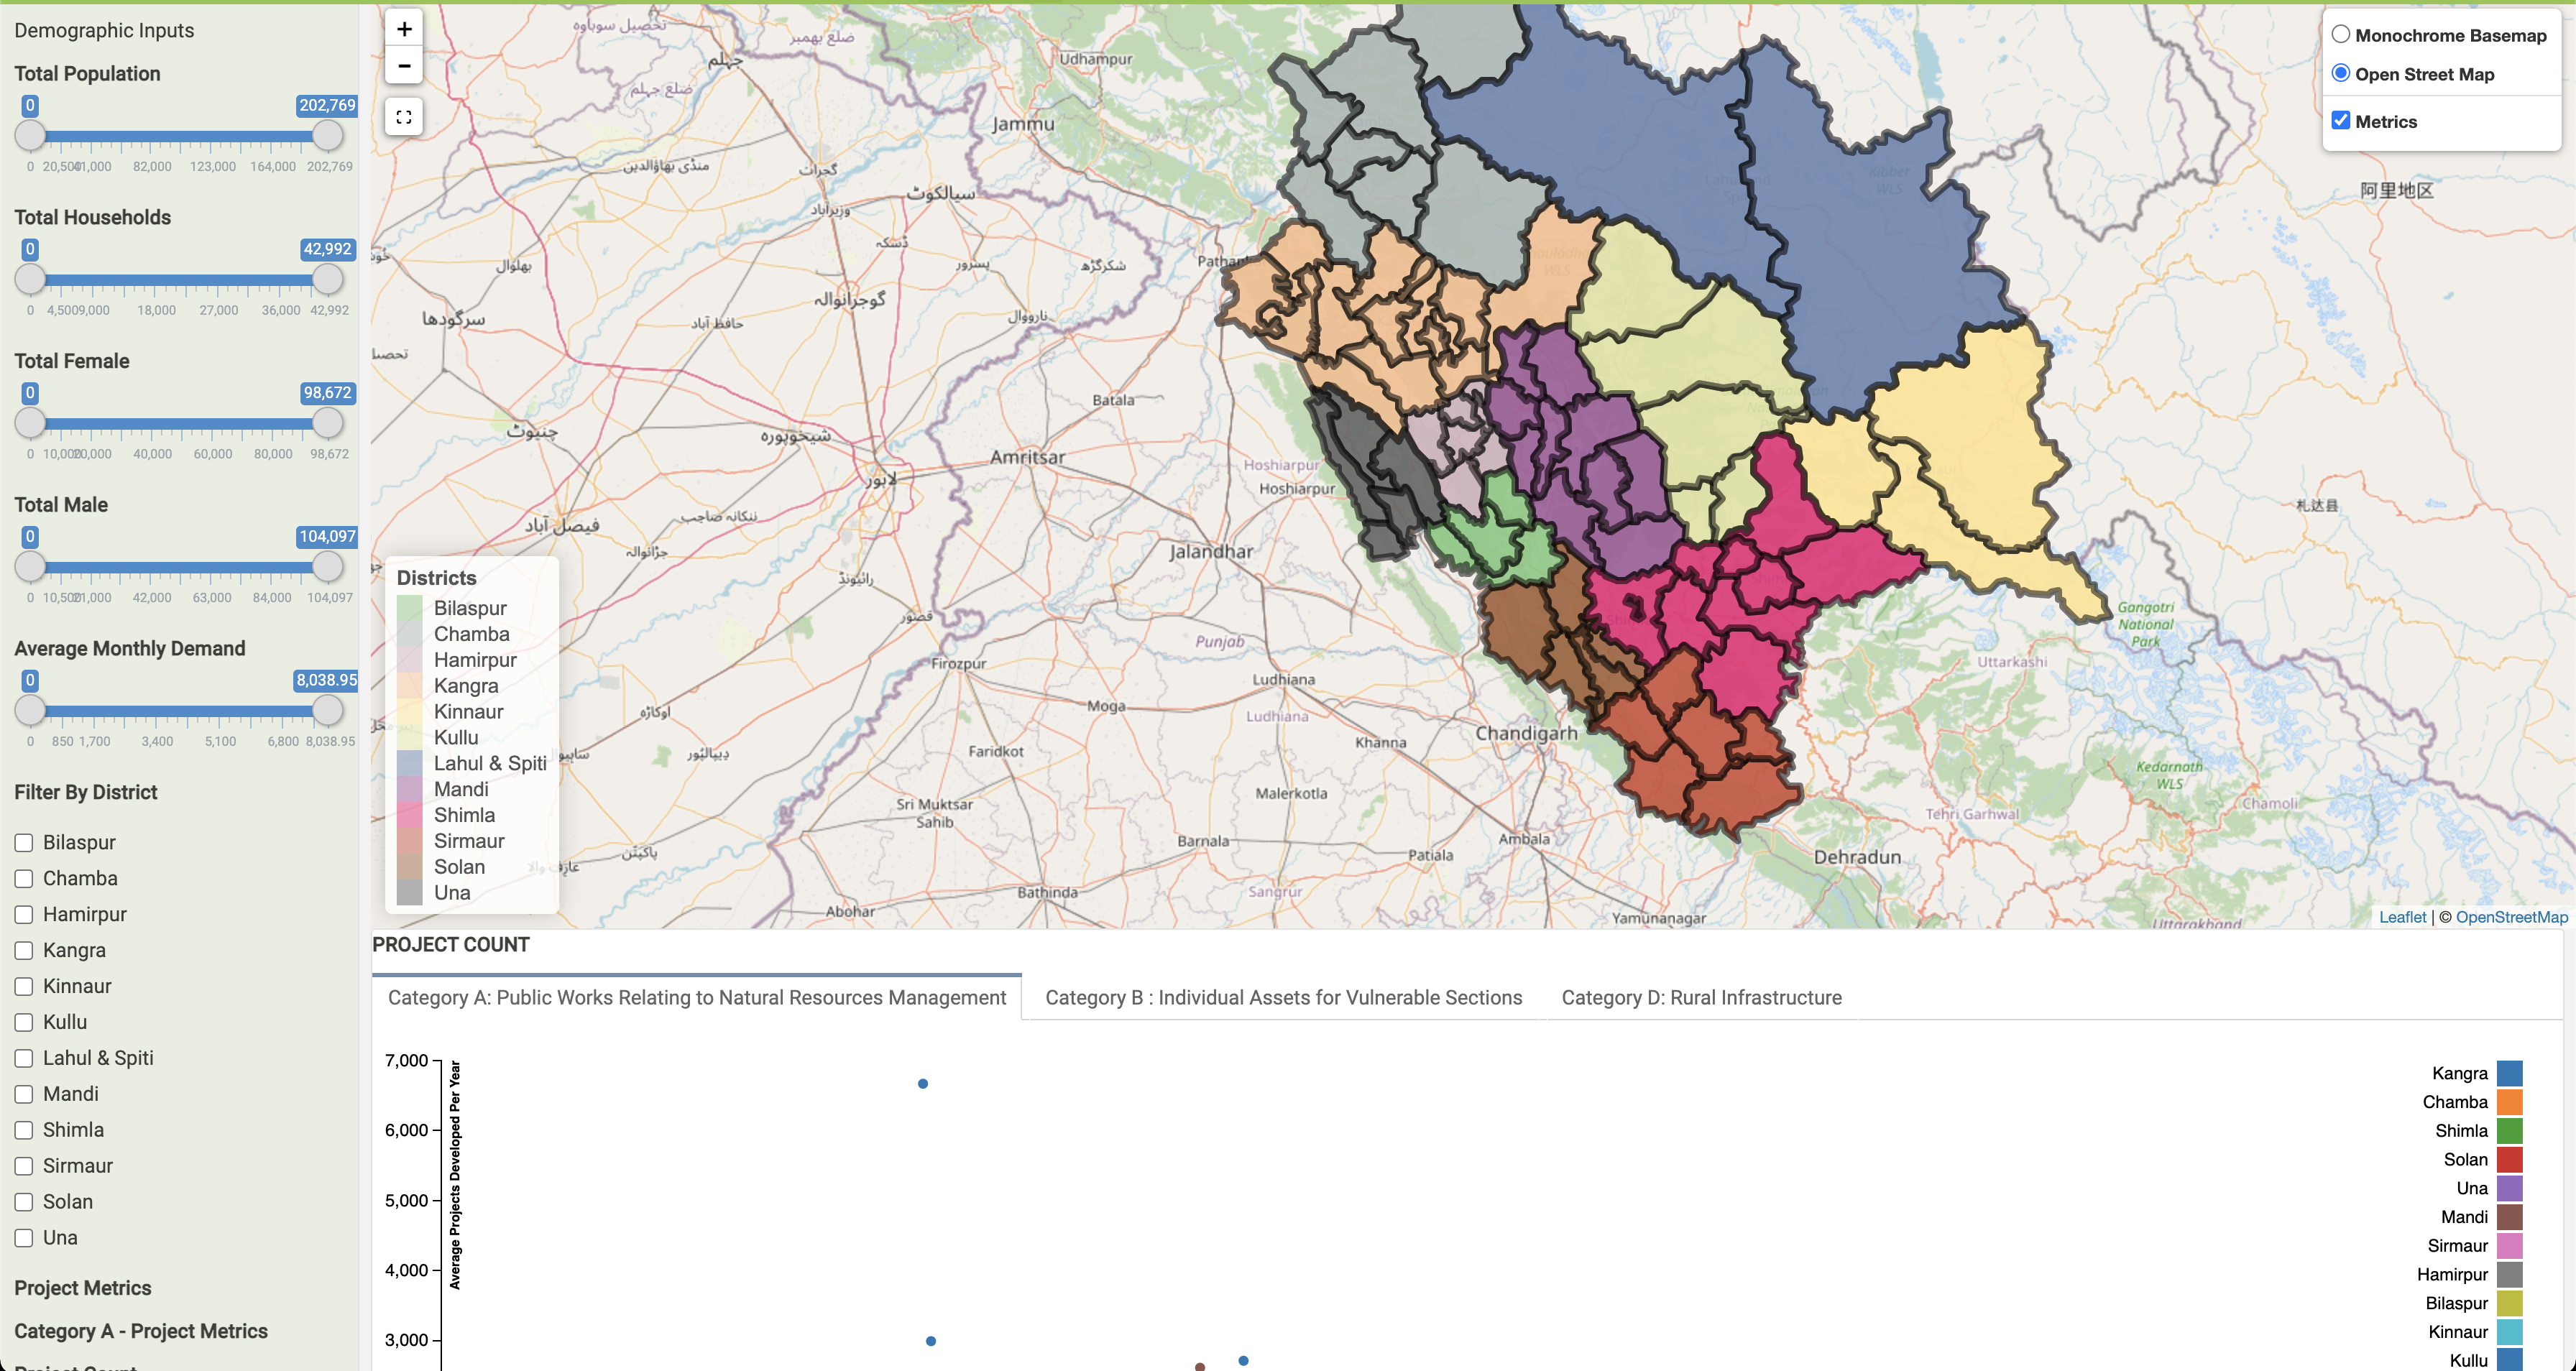
Pulse on Welfare Outcomes and Rural Infrastructure in Himachal Pradesh
In today’s IndiaPulse@ISB , we develop a ranking of blocks based on measurables that matter, such as Supply of electricity, Access to financial services, healthcare infrastructure, Sanitation facilities and more! A typical rural block is about 50,000 households
We talk about which blocks need to be prioritized for future infrastructure development, and which blocks generally have a higher per capita demand for MNREGA benefits, implying high seasonal unemployment.
By using two independent public datasets*, we provide 5 key metrics for measuring the economic health of a block and rank these blocks basis these.
- Total Project Count
- Cost Per Project
- Average Project Cost Per Year
- People Employed Per Asset
- Ratio of Skilled to Unskilled Labour in asset development
- We observe that higher infrastructure benchmarks correlate with lower demand for MNREGA.
- We also observe that project costs are high in Blocks that have poor access to transportation infrastructure.
- Geographically, lower regions of Himachal Pradesh have better infrastructure and lower per capita uptake of the MNREGA.
- We pose some interesting questions:
-
- What kind of infrastructure development projects can help lower reliance on MNREGA demand?
- Does a lower MNREGA demand correlate positively with the economic health of a block?
- What category of infrastructure development undertaken by the state enables optimal use of MNREGA workers?
25 Mar
2021
2021
Diri
Video:
1. The two data sources used are:
- MNREGA Mapping of Assets from 2007-2021
- Village level infrastructure benchmarks published under Mission Antyodaya 2018-2019 survey
2. The MNREGA Mapping is divided into categories under which unemployed individuals build assets -
- Category A: Public works Relating to Natural Resource Development
- Category B: Individual Assets for Vulnerable Sections
- Category D: Rural Infrastructure
- Category C: Common Infrastructure for NRLM compliant Self-Help Groups has not been included due to the unavailability of data
25 Mar
2021
2021
Diri
Dashboard
Explore the dashboard for the following insights
1. Identify most and least developed blocks across the state of Himachal Pradesh based on scheme-based metrics and infrastructure outcomes.
2. Explore domains across which infrastructure outcomes are consistently high or low in relation to key metrics such as Cost Per Project and Skilled/Unskilled Labor Ratio.
3. Compare relative and absolute ranks of Development Blocks in Himachal Pradesh to identify focus areas and aspirational districts
Pulse Community Mobility in COVID-19
How do we move? What aspects of our public life did the pandemic impact and what can we learn?
IndiaPulse@ISB offers high-resolution insights into the impact of the pandemic on the mobility of communities across states, during lockdown.
#mobility #googlemobilityreports #DIRI #covid19org
By using two independent public datasets*, we look at how the mobility of individuals has been affected in different categories of public places. The categories studied here are workplaces, Residential areas, commercial areas, etc. Location, nature of the predominant economic activity, the onset of the pandemic, and rate of the pandemic are all variables that define mobility.
1. We observe that sudden deviations in mobility expectedly coincide with major statewide and nationwide lockdown and unlock timeframes.
2. We observe a clear transition of communities from workplaces to residential areas
3. There are also intermittent spikes that tend to coincide with local rise or fall in COVID-19 cases and gradual opening up of the economy.
4. We pose some interesting questions:
- Considering the pandemic as a shock to mobility of communities, how sensitive is community behavior to such disruptions and policy tactics?
- What can mobility of individuals during COVID-19 inform us about the design of future infrastructure that can potentially assist in absorbing such shocks?

18 Mar
2021
2021
Diri
Video:
1. The two data sources used are:
- Google COVID-19 Community Mobility Reports
- Crowdsourced repository of COVID data - Covid19india.org
2. The Google COVID-19 Community Mobile Reports are a limited-time release of anonymized, aggregated data from users of Google Services, specifically from users who have turned on their Location History.
18 Mar
2021
2021
Diri
Dashboard
Explore the dashboard for the following insights
1. Impact of critical lockdown policies on place wise mobility
2. Daily change in Mobility versus COVID-19 cases
3. Mobility as a function of location and onset of pandemic.
Pulse on Urbanisation
This week in IndiaPulse@ISB, we explore how urbanization can be inferred, visualized and compared. Rapid urbanization of India has been one of the greatest global phenomena over the last two decades.
We reference the Tier-based Census classification of 2011 to highlight how quickly urban areas grow beyond this classification.
1. We discuss two metrics of urban growth over time: Radiance of Night Lights and the spatial spread of the urban area itself.
2. We show that across time, especially post 2004, urban areas have outgrown their tiered definitions.
3. The color scheme of classification from the 2011 census shows Green colour shows Tier 1 areas, Red colour shows Tier 2 areas, Blue shows Tier 3 areas.
4. This clustering changes rapidly over time as can be seen from the time-based simulation.
5. We see that across time, especially post 2004, urban areas such as Surat(GJ), Agra(UP) and Rajmundhry(AP) have outgrown these definitions.
6. Urban governance decisions based on this prior classification therefore may be inadequate.
7. Also, Critical junctures of this such as pan-India growth in urbanization can be seen clearly in the year 2000 from the sidebar.
8. We also observe, that despite similar starting points, urban areas grow with different accelerations.
9. Location of an area plays a defining role in the direction of urbanization, such as presence of geographical barriers or proximity to other municipally defined economic clusters.
10. Twin cities such as Bhubhaneshwar and Cuttack merge other over time due to governance initiatives.

11 Mar
2021
2021
Diri
Video:
1. This dashboard helps in understanding spatial patterns of growth in cities and allows the identification of rapidly growing urban areas.
2. Location of an area (Coastal vs Land Locked), Geographical barriers (Mountain Ranges and Rivers) impacts both the rates of growth and the direction of growth.
3. Coastal urban areas as Mumbai and Chennai grow along a linear axis as opposed to landlocked areas such as Delhi and Pune.
4. Critical junctures of the spatial growth and economic activity can be identified through the sidebar visualizations.
5. This activity also helps identify pockets ripe with jobs, trade, and economic opportunities.
11 Mar
2021
2021
Diri
Dashboard
Explore the dashboard for the following insights
1. On the map of India, the Green colour shows Tier 1 areas, Red colour shows Tier 2 areas, Blue colour shows Tier 3 areas.
2. City-level economic activity is measured through night lights
3. As an urban area grows, the radiance per unit area may drop, as peripheral growth in urban areas starts with a low density of activity. But the radiance picks up fast
4. This can be seen in the rapid movement of small and medium urban areas starting in the early 2000s.
5. Urban areas bifurcated by river bodies such as Patna and Vijaywada tend to grow across the water body.
Pulse on Women's Participation
IndiaPulse@ISB celebrates women’s history month. # InclusiveGrowth
This week we provide insights into women’s participation in the industrial workforce. The state of India’s economy, when compared to BRICs nations, is at the point when large numbers of women should be expected to enter the labour force. Many positive empowerment outcomes for women are linked with their participation in the economy.
- The source of this data is the annual survey of industries conducted by Ministry of Statistics and Programme Implementation
- The survey asks managers of different industries across states to report percentage of man days ( person days ) involving women in the given financial year
- Many interesting findings emerge such as women participation rate varies from 2% in Chhattisgarh to 54% in Manipur
- North eastern and southern states typically perform better in terms of participation rates of women
- Higher participation rates of women do not corelate with lower wage differentials
Plug in deeper to explore themes such as gender wage differential across states and across industries

04 Mar
2021
2021
Diri
Video
We pose some interesting questions:
1. Should states think about investing in developing a skilling infrastructure for women for higher paid work to reduce wage disparity?
2. Can quotas for women at work help increase women participation and reduce wage differential?
3. Would migration support for women play a critical role in their participation rates?
04 Mar
2021
2021
Diri
Dashboard
Explore the dashboard for the following insights
1. Women in Industrial Workforce in different states
2. Average gender Wage differential by state
3. Workforce participation by women by industry sector
4. Gender wage differential by industrial sector
Pulse on MSME & Infrastructure
IndiaPulse@ISB goes spatially granular and focusses attention on the state of Tamil Nadu. # InclusiveGrowth
This week we help MSME’s decide where to locate:
- We show 3 types of industrial clusters and their locations
- Clusters are labelled A, B, C depending upon their reliance on a specific infrastructure
- Those incentivized by the TN state govt are classified as A; Those requiring healthcare facilities as B; And those whose supply chains predominantly depend upon the road and railways network, as C.
- We also highlight geographical areas where the Tamil Nadu Government has extended incentives to MSMEs to boost up economic growth ( http://www.indcom.tn.gov.in/).

25 Feb
2021
2021
Diri
Video
Micro, small and medium Enterprises (MSMEs) are the growth accelerators of the Indian economy, employing over 100 million people across the country.
We now invite other state governments to connect with us to mutually explore mechanisms to boost growth. We help you with:
- Where should you, as state administration, invest the next Rupee.
- Where and what kind of infrastructure will enable MSME’s to set up shop and generate employment
25 Feb
2021
2021
Diri
Dashboard
This week at IndiaPulse@ISB, if you are an MSME requiring specific local infrastructure or incentives, we tell you where these locations are in the state of Tamil Nadu.
We also invite researchers, policy leaders , think tanks and others to explore the dashboard and send us your comments.
Pulse on Production
We IndiaPulse@ISB are in the business of measuring what matters
This week we show:
- What new sectors did the Union Cabinet extend the existing Production Linked Incentive (PLI) Scheme to
- Which sectors can be the new movers and shakers of the production economy
- Where can you roll up your sleeves and get ready to manufacture, and
- Where these future national champion companies are located and how many workers do these employ

18 Feb
2021
2021
Diri
Video
Let’s Make_In_India. Under Atmanirbhar Bharat, The Union Cabinet, chaired by the Prime Minister, Shri Narendra Modi, had approved production-linked incentives for 10 sectors : pharmaceuticals, automobiles, telecom, advanced chemistry cell batteries, textile, food products, solar modules, white goods, and specialty steel. We wish well for this ecosystem to take off from here by attracting capital and encourage domestic employment.
18 Feb
2021
2021
Diri
Dashboard
This week at @IndiaPulse, if you are an organization willing to set up shop and roll up your sleeves, hire workers and get ready to manufacture, we tell you where you can do it.
We also invite researchers, policy leaders , think tanks and others to explore the dashboard and send us your comments.
Pulse on Andhra Pradesh
This week, we show:-
- "Current" Economic Activity can be measured using electricity consumption data in near real-time.
- Shows Economic Activity at 1km long Hexagon
- Coded by different industries, Agriculture, Services, Machinery, Wood
- Month by Month data from 2019 to 2020 shows seasonal patterns
- Indicates that compared to 2019, the activity after October in 2020 has not picked up fully

11 Feb
2021
2021
Diri
Video
We measure the economic activity using real time electricity consuption data for Andhra Pradesh for the year 2019 and 2020
11 Feb
2021
2021
Diri
Dashboard
You can visualise the relationship between economic activity, coded by different industries and electricity consumption data for the year 2019-2020
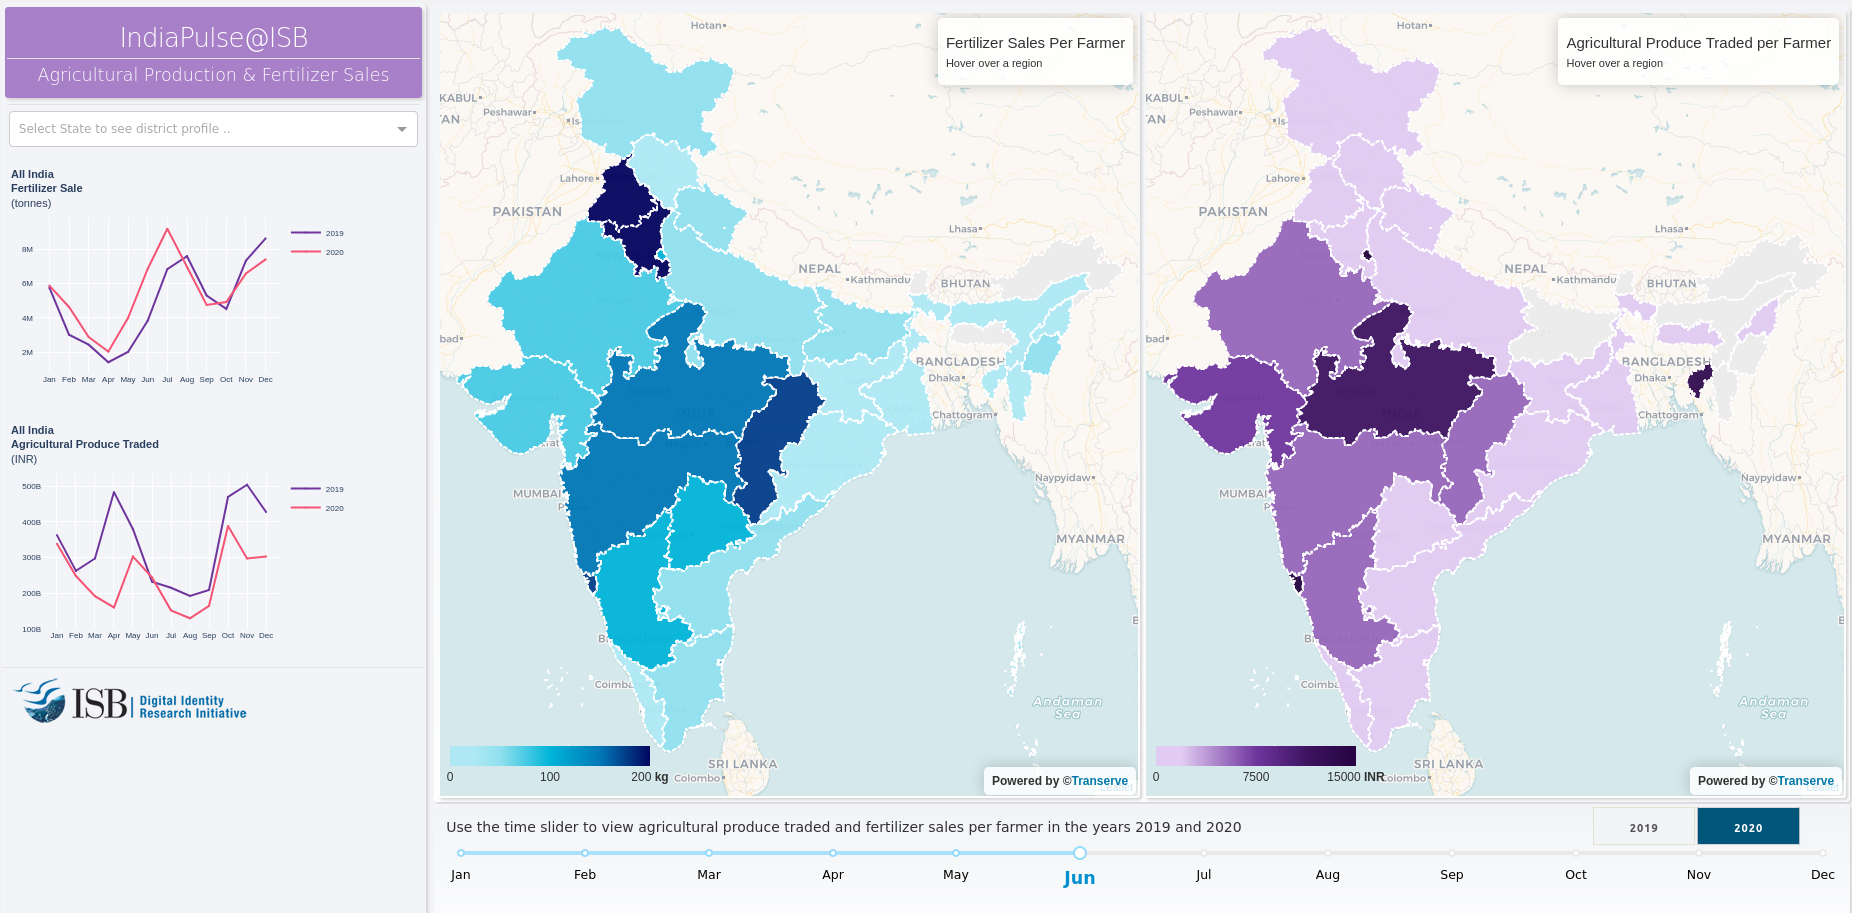
Pulse on Agricultural Production and Fertiliser Sales
This week, we show:
- All India: Compared to 2019 levels, Fertiliser sales have remained the same, while the transacted value of agricultural produce shows variations.
- Lockdown effect: Some states as Odissa have emerged largely as unaffected, while others as Maharashtra have seen a dip in the value of agricultural produce traded in mandis aggregated over the past year.
- Punjab: Mandi data in Punjab shows a steep dip at the end of 2020. Can it be due to the farmer’s strike?
- Missing inventories: Fertilizer sales are a good proxy for agricultural produce. While fertilizer sales pan India have largely remained the same, The value of traded agricultural produce in mandis has seen a substantial dip in 2020. To combat future disruptions in supply chains of perishable goods, data suggests an increased investment in storage facilities.
- We now invite researchers to examine this data at the district level across the 2 years.
04 Feb
2021
2021
Diri
Video
We present the relationship between fertiliser sales per farmer and agri produce per farmer during 2019-2020
04 Feb
2021
2021
Diri
Dashboard
We allow you to visualise the relationship between fertiliser sales per farmer and agri produce per farmer during 2019-2020
__________________________________________________________________________________________________________________________________
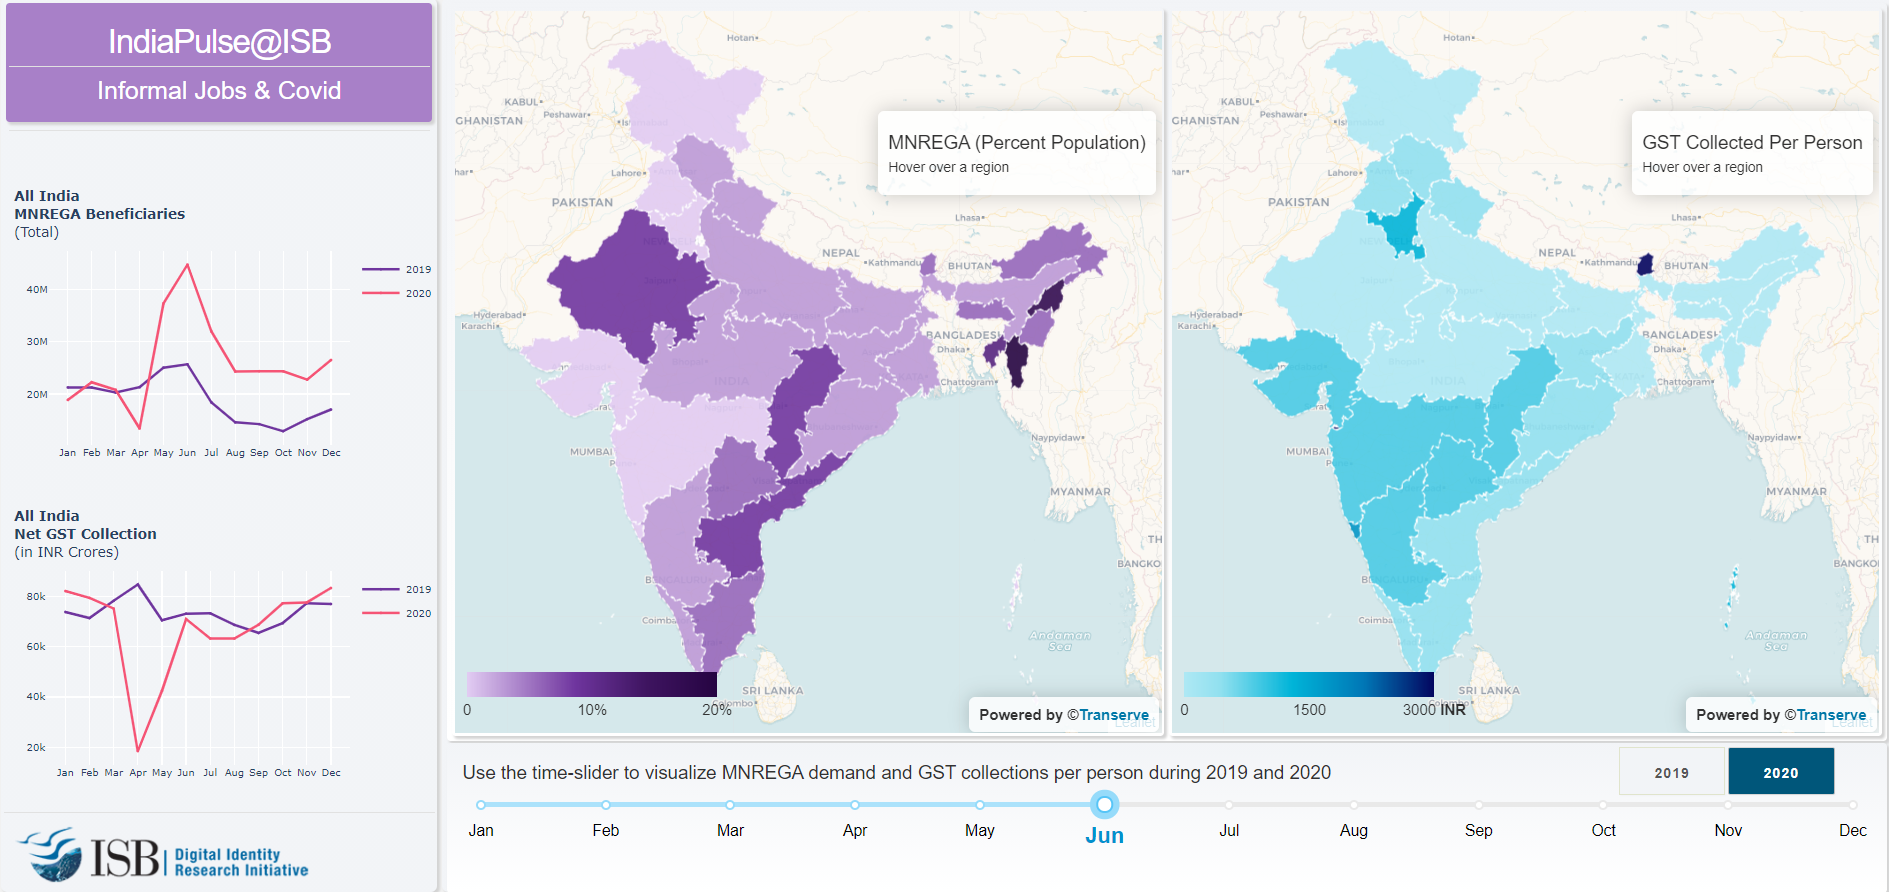
Pulse on Informal Jobs
This week, we show:
- Informal workers apply for MNREGA when they are not able to find jobs.
- There is a lag of one to two months between a downturn in economic activity and workers seeking MNREGA.
- Even though economic activity may have largely recovered by the end of 2020 after suffering a sharp downturn in April, informal jobs have probably not recovered enough back to 2019 levels.
- There is a large variation across states with some north-eastern states such as Mizoram with more than 15% of the population seeking MNREGA jobs all throughout the year.
28 Jan
2021
2021
Diri
Video
We present the relationship between MNREGA demand and GST collections per person during 2019 and 2020.
28 Jan
2021
2021
Diri
Dashboard
The dashboard allows you to visualise the MNERGA demand and GST collections per person during 2019 and 2020
__________________________________________________________________________________________________________________________________
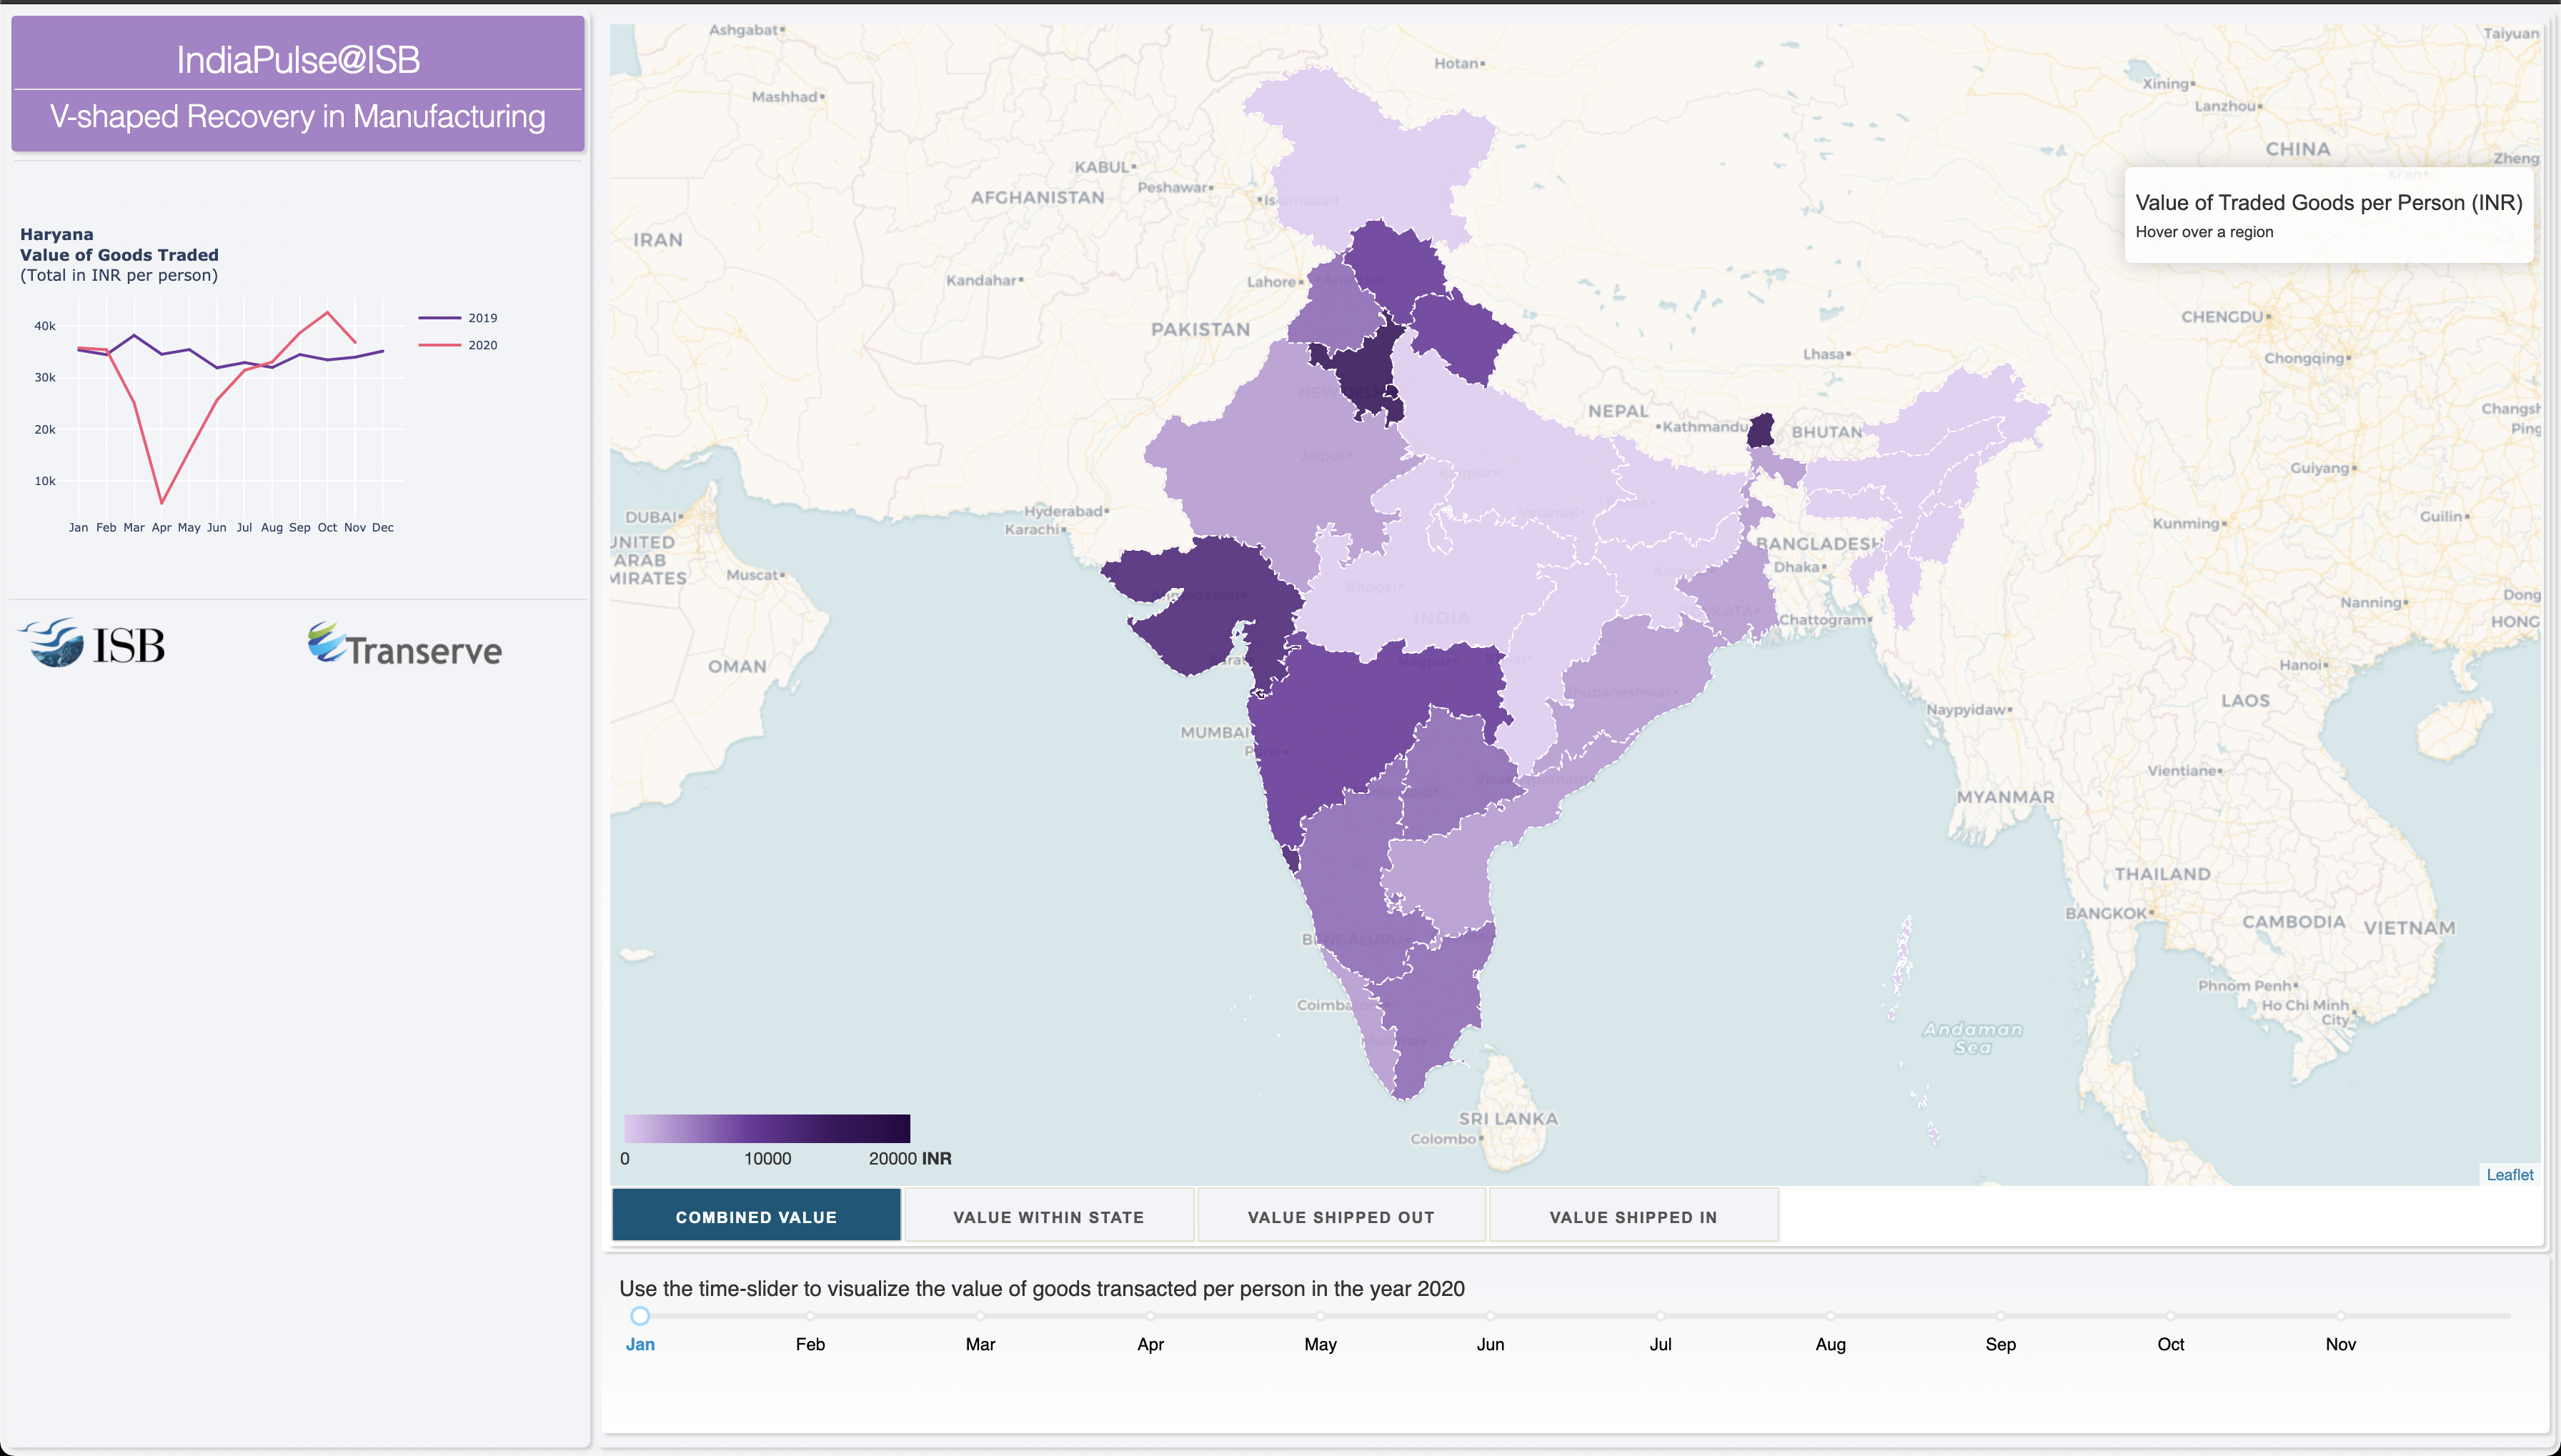
Pulse on Jobs, Workers and Skills
This week, we show:
- Tamil Nadu, Gujarat and Maharashtra have the greatest number of manufacturing jobs. Workers from other states migrate to these states for jobs.
- These three states also have the largest number of facilities for acquiring skills. Also Kerala, which does not have lot of manufacturing jobs.
- The future jobs will be located around the industrial corridors around the golden quadrilateral. A lot of skilling centers need to be developed around these. Currently, there are scarce at these locations.
- The eastern coast corridor, with ports in AP and Tamil Nadu could become the export centers for east Asian countries.

21 Jan
2021
2021
Diri
Video
We present the analysis on where should the investment in skill training be prioritized for economic growth and wellbeing
21 Jan
2021
2021
Diri
Dashboard
The dashboard allows you to see where are the workers? and where are the future jobs?
__________________________________________________________________________________________________________________________________
14 Jan
2021
2021
Diri
Video
We present the analysis on the level of manufacturing by examining the value of e-way bills generated month on month across states.
14 Jan
2021
2021
Diri
Dashboard
The dashboard allows you to compare state-level activity each month from the 2019 benchmark.
__________________________________________________________________________________________________________________________________
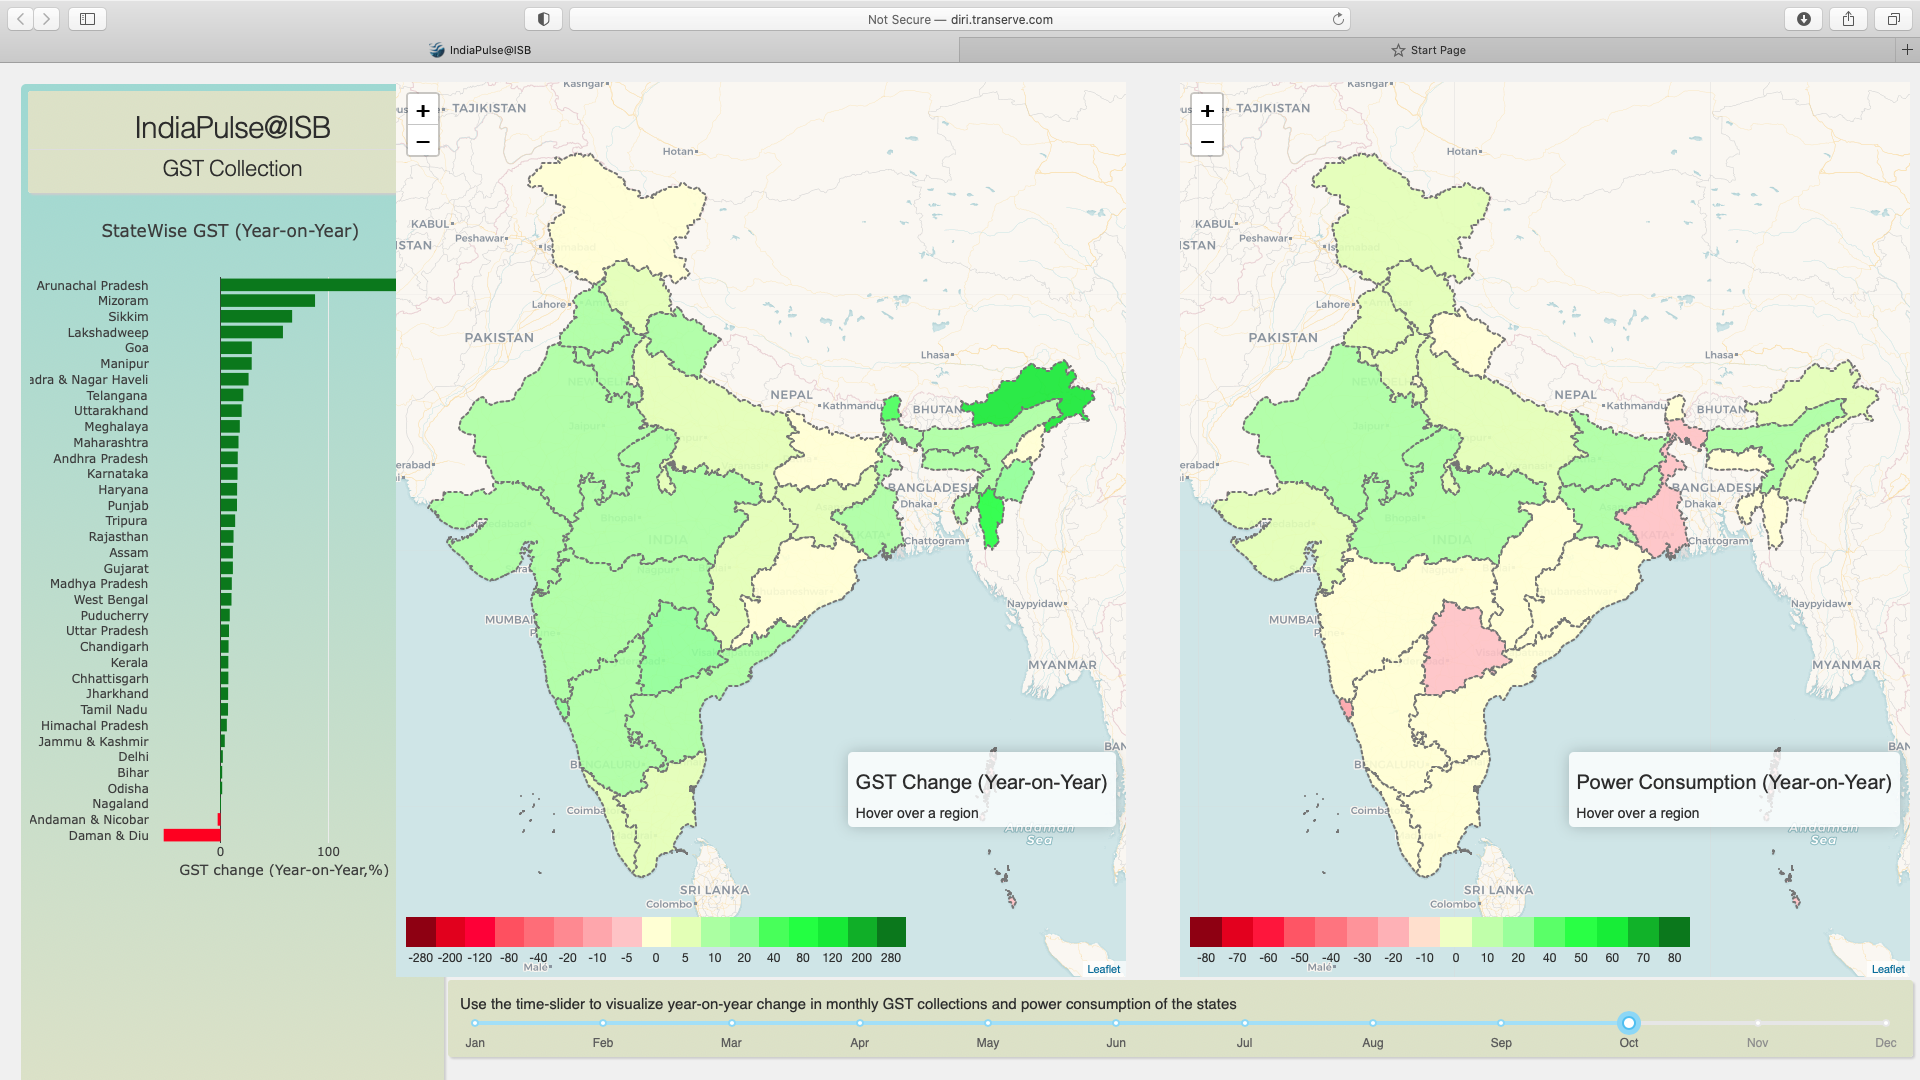
Pulse on GST
This week, we show:
- Growth in GST collections, month by month from, 2019 to 2020, for every state.
- Main findings:
○ GST collections began to weaken in February 2020.
○ April 2020 was the worst month across all states.
○ Recovery began by July 2020.
○ By October 2020, all states appear to have recovered.
○ By December 2020, data indicates that GST recovery was faltering in some states.